Saturday, May 19, 2012
What next week brings... 19 May 2012
Oh what a week!
Global markets tanked in the midst of uncertainty and looks like there may be more to come.. the "Sell in May and Go Away" sure worked this round. Not to be too surprised as the market was way overbought as April ended.
So what does this week's technicals tell us to expect of next week?
/ES
The S&P weekly chart is clearly is not in a bullish trend any more. A sell signal and momentum confirmation is a good indicator of downside for the S&P500 futures over the next few weeks. The daily chart is a little extreme in the bearishness, being oversold and looks to bounce (dead cat) some time later next week, but not before a tad more downside early in the week.
VIX
The volatility cycle has started about 1.5 months ago, and this week confirms a breakout to the upside in the weekly chart. The daily chart is also a little extreme but looks to corroborate with the /ES analysis of spiking early next week, and then retracing later in the week.
/DX
The USD futures are clearly having a good rally. With higher USD, lower Crude, Gold and Equities. Need I say more?
/GC
Gold hit the support and buyers entered the market to give an awesome 2 day rally to recover the Gold price. However, from the weekly chart, I am a little cautious about this rally and rather wait out at this point. Gold buyers are acting on the Euro contagion uncertainty, but in a true panic, these will be washed out nonetheless. The weekly chart is confirming lower Gold prices, but the daily shows a bounce off 1540 support level.
AAPL
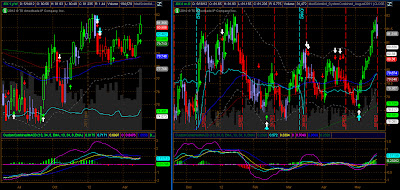
Again, featured as I am watching this closely, particularly after a parabolic run which was followed by a topping pattern. The weekly chart is favourable for further downside over the next two months. The daily chart is similar, even having moved significantly downwards over the past three weeks, it is still signalling an immediate downside into the coming Tuesday before a potential technical bounce is expected. Monday should open down for the morning session.
It's really bearish, and I suspect that Facebook breaking below $38 would pressure the NASDAQ to sell off.
DBA
Ah... my favourite, play for the next 10 years... Soft commodites. Despite a drop across almost all market sectors, DBA (Sugar, corn and wheat ETF amongst other things) actually had a buy signal on the daily chart. This follows a bullish divergence and a bounce off the extremes. The weekly chart has a bullish engulfing that is probable to work. This one is good for going long long term IMHO.
Be safe, have fun!
The MadScientist
19 May 2012
Note: ALL material posted here is from my personal opinion, and my opinion may differ or change without notice. These do NOT constitute as solicitation, investment nor financial advice. By reading the materials presented here, Readers acknowledge the awareness that the materials are intended for educational purposes only. For investment(s) advice, related decisions and/or actions pertaining to investments, always consult your own qualified financial advisors, brokers, etc.
Charts are from TD Ameritrade Thinkorswim platform
Labels:
MadScientist's Market Analyses
Subscribe to:
Post Comments (Atom)


No comments:
Post a Comment