Daily chart for Dow

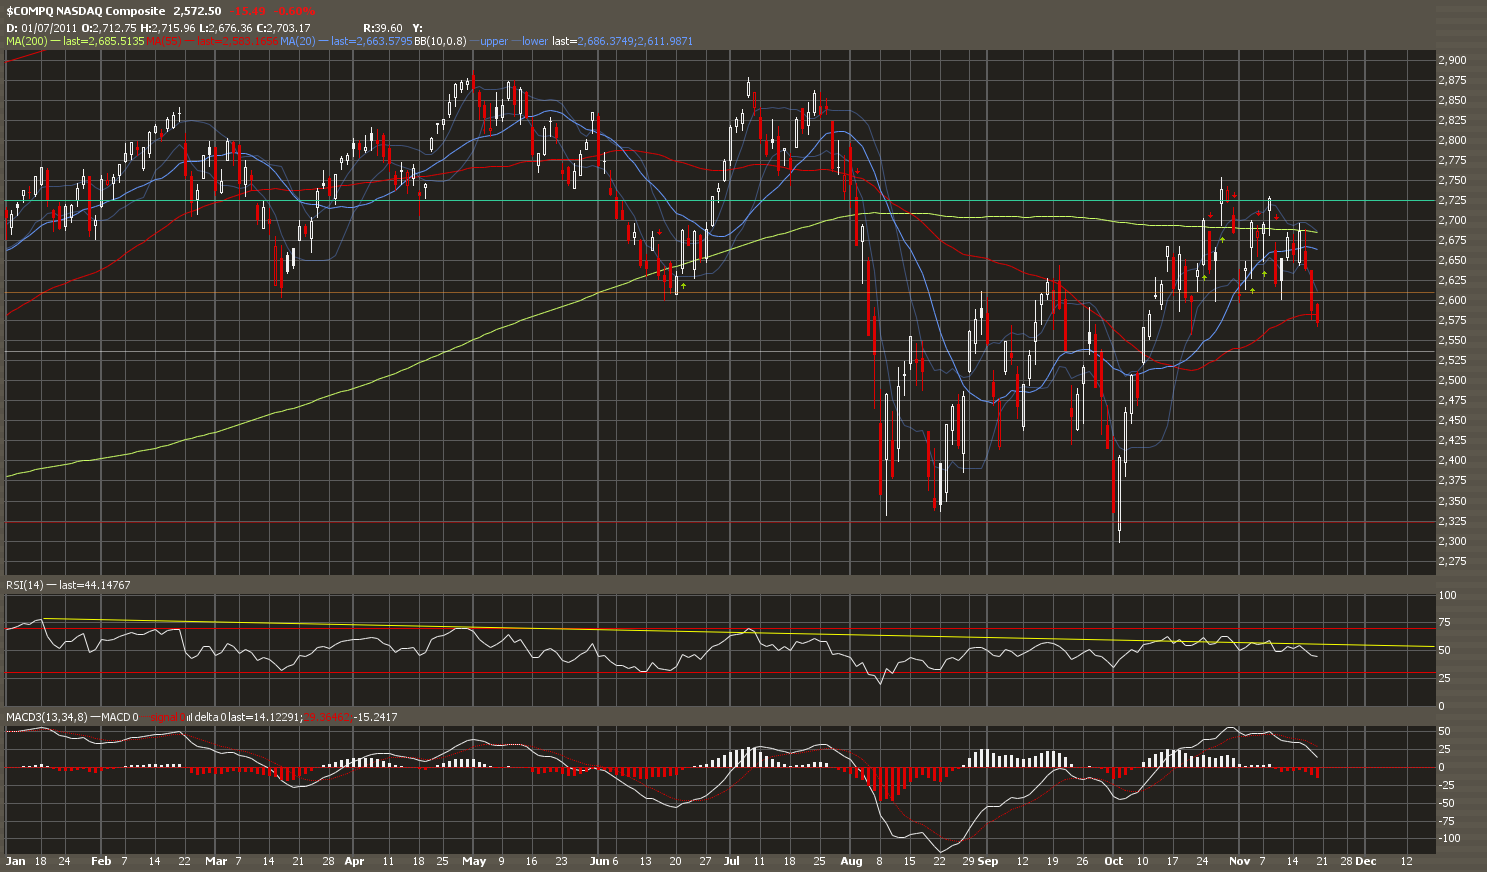
Daily chart for NASDAQ

Market analysis from last week:
“We dipped after a huge rally that changed all my indicators from bearish to bullish. On Friday, the market closed around important support levels for all 3 indexes. This is 1215 for S&P.
Today, we shall see whether these support levels hold. If it holds, the chances that we will see a Santa Claus Rally would be much higher.
Currently, I believe that the market will hold these support levels and move up to 1350 by year end or early Jan 2012.”
Market analysis for this week:
The past week had been one of the most bullish for the past few months. This is just the start of the huge bullish divergence pattern that appeared on the charts a few weeks ago. This should bring the S&P up to around 1,350 over the next 2-4 weeks. This will be around 12,750 for the Dow.
Daily chart for the Dollar

Market analysis from last week:
“The dollar (UUP) made yet another bearish divergence in the market on daily charts. However on weekly charts, it seems that the dollar has more to go. At least around 2 more weeks of bullish movement before it finally give way. As the market movement is inversely correlated with the stock market, this might mean that we will have 2 more weeks of bearish market. This will directly cut into the Santa Claus rally. We shall see how it goes.”
Market analysis for this week:
Longer term weekly chart is showing that the dollar will continue to go up, but on daily, it shows down. We might see some weakness in the dollar over the next 2 weeks. First target at 22, second at 21.70.
Daily chart for Gold

Quote from my last market analysis:
“Gold broke out of the triangle last Monday and completed the breakout move by the end of the week. Price closed just below it’s 200 day moving average on Friday.
Today, we should see gold consolidate after a big move. Especially with a strong and rising dollar, we should see further lower prices over the next 1-2 weeks. Next support at around 1500 on gold futures.”
Market analysis for this week:
Gold is still consolidating after the huge movement. It may trend down to 145 on GLD over the next few weeks. It should move in a range between 145 and 158.50 for the next 1-2 months.
Daily chart for Crude Oil

Market analysis from last week:
“The uptrend did indeed end last Tuesday with a gap down and drop over the rest of the week.
Now with crude at it’s 50 day moving average, we should see either a consolidation or bounce before dropping further over the next few weeks. Next support at 35 and then 33.50 on USO.”
Market analysis for this week:
Crude oil is more bullish than ever, having bounced off it’s 50 and then 200 day moving average in the past week. I believe we should see a dip next week with support at around 37.50 on USO before breaking resistance at 39.50.
Final target will be around 45.20 in 3 month’s time. This will be around 113 on crude oil futures. Expect gasoline prices to increase.