
Daily chart for Dow

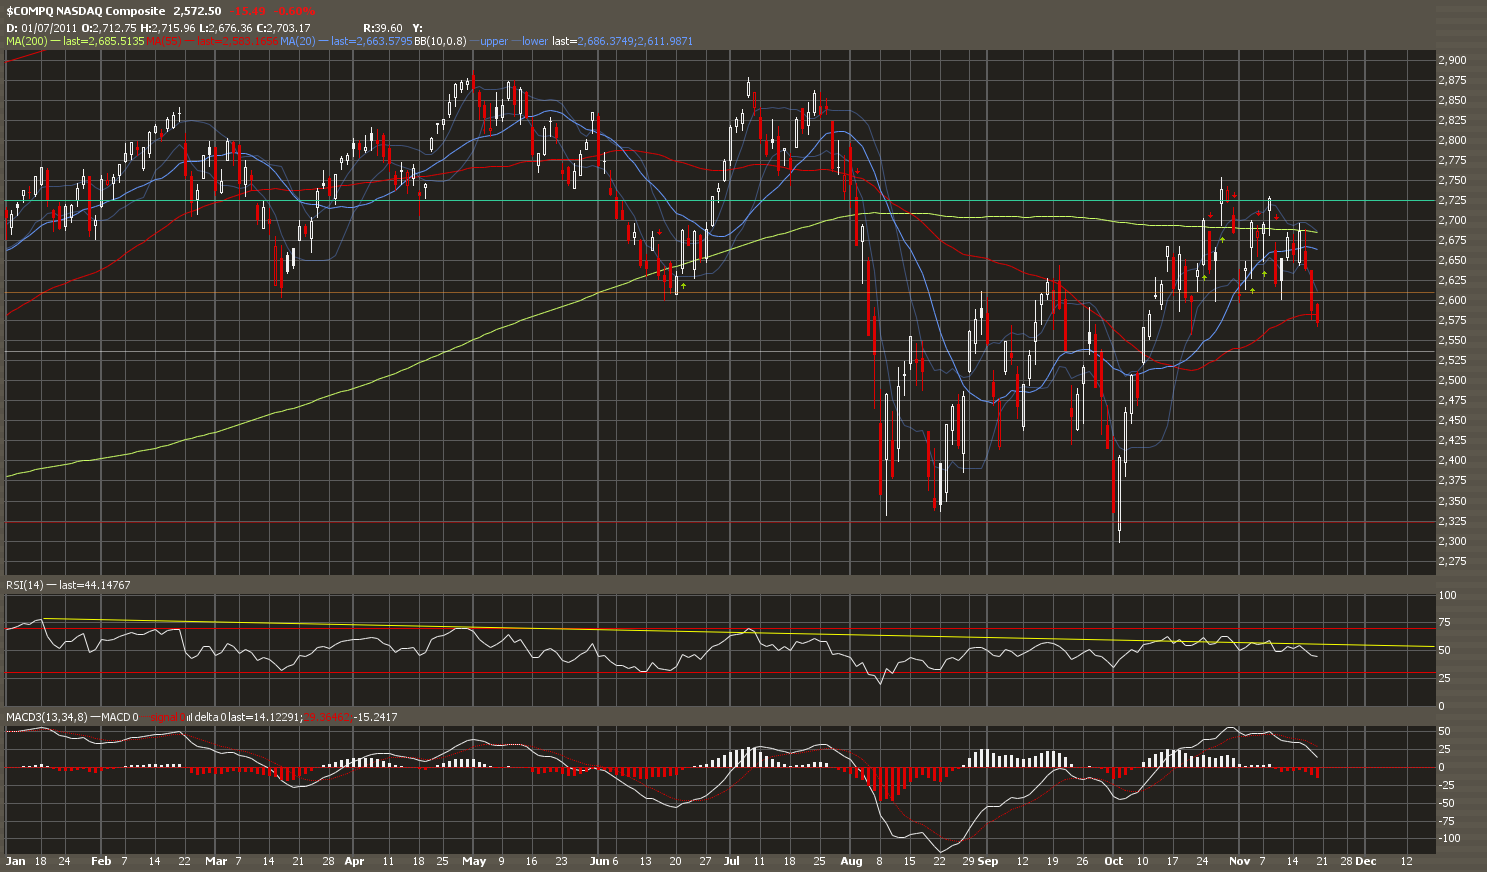
Daily chart for NASDAQ
Last week's market analysis:
“Anyway last week ended as a doji on S&P. We should see some market gyrations over the next few days as we hit a range of important resistance levels. On daily and weekly RSI, we are seeing a widening bearish divergence. I believe we are at a market top right now and the market is just churning, stronger hands giving way to weaker hands. Once the pros have moved out of the market, the market should give way real soon. I think we would end the year much further down then the levels we are at today. Most probably we should end the year at the early October 2011 lows.”
Market Analysis for this week:
The S&P closed at its 50 day moving average last Friday and all 3 indexes were forming classic daily patterns of market topping throughout the week as we slowly trend downwards. My trading system also highlighted a bearish signal on Thursday. As we move into the December and the famous Christmas rally, I was cautious of being too bearish in a seasonally bullish period of the year.
Then during the weekend, this news came up.
http://www.bloomberg.com/news/2011-11-21/u-s-debt-supercommittee-is-said-to-be-poised-to-announce-failure-of-talks.html
With the situation in Europe going from bad to worse, and reports of repercussions of bad debts moving across the Atlantic into US, this will definitely move the indexes below their 50 day moving averages. (Only the Dow is still above now) On weekly charts it looks even worse. All 3 indexes are showing classic signs of failure and should hit their early October 2011 lows by the end of the year.
Daily chart for the Dollar

Last week's market analysis:
“The dollar has bounced back up above its 50 and 200 day moving average, indicating bullishness. This should be the case for the rest of the year.
We should move back up to the early October 2011 highs over the next few weeks”
Market analysis for this week:
Analysis for the dollar is still the same.
Daily chart for Gold

Quote from my last market analysis:
“Gold has been showing strength over the past few weeks, breaking the 50 day moving average. I am seeing a bullish signal today. If this follows through, we should see gold break its high at 1923.70 soon. With the mess in Europe getting out of hand and rating agencies making mistakes, this should not be too difficult.”
Market analysis for this week:
Gold had been bouncing off its 50 day moving average throughout last week as a rising dollar puts bearish pressure on the price of gold. With such bad news coming out of both Europe and US, I believe we should see gold at an all-time high in the next few months.
Daily chart for Crude Oil

Last week's market analysis:
“Crude oil had one of the best bullish runs over the past 2 months. However we are reaching the end of this rally soon. My target is at 103 on /CL. Crude oil is very close to being overbought and this straight up rally movement is not sustainable. We could have a repeat of the late April to early May 2011 type of drop. I would expect crude oil to do move back down later this week or next week.”
Market analysis for this week:
Crude dipped as expected and found support at its 200 day moving average. This is especially so after a steep uptrend and is healthy if we are to have a sustained rally in crude. Supports for this dip should come in at 37.60 and then 35.20.
No comments:
Post a Comment