Daily chart for S&P

Daily chart for NASDAQ

This is one of those times where it’s difficult to make a decision on the market. There are conflicting signals in the market and with volume so low, I couldn’t figure out which one would be more reliable. Low volume really screws up our technical analysis. Most experienced traders that I know are already out or getting out of the market. Maybe I should switch to a 2 day chart or more.
Anyway this coming week will be the start of the Christmas rally and I’m having a feeling that we might not have it this year. We shall see how it goes this week.
Daily chart for the dollar (UUP)

The dollar is moving according to the fibo retracement. We might see some fierce resistance at 23.80 but other than that, it should be a nice rally up.
Daily chart for Gold (GLD)

Gold is making a consolidation move. It is still on a huge bullish trend with no end in sight though. Target at 143.
Daily chart for Silver (SLV)

Silver’s parabolic trend is far from over. I believe its uptrend should end around the same time as gold’s. Anyway I’ve got a target at 35 and strong support at 25. Once it breaks 25, this uptrend would be over. I believe now should be a good time to enter on silver.
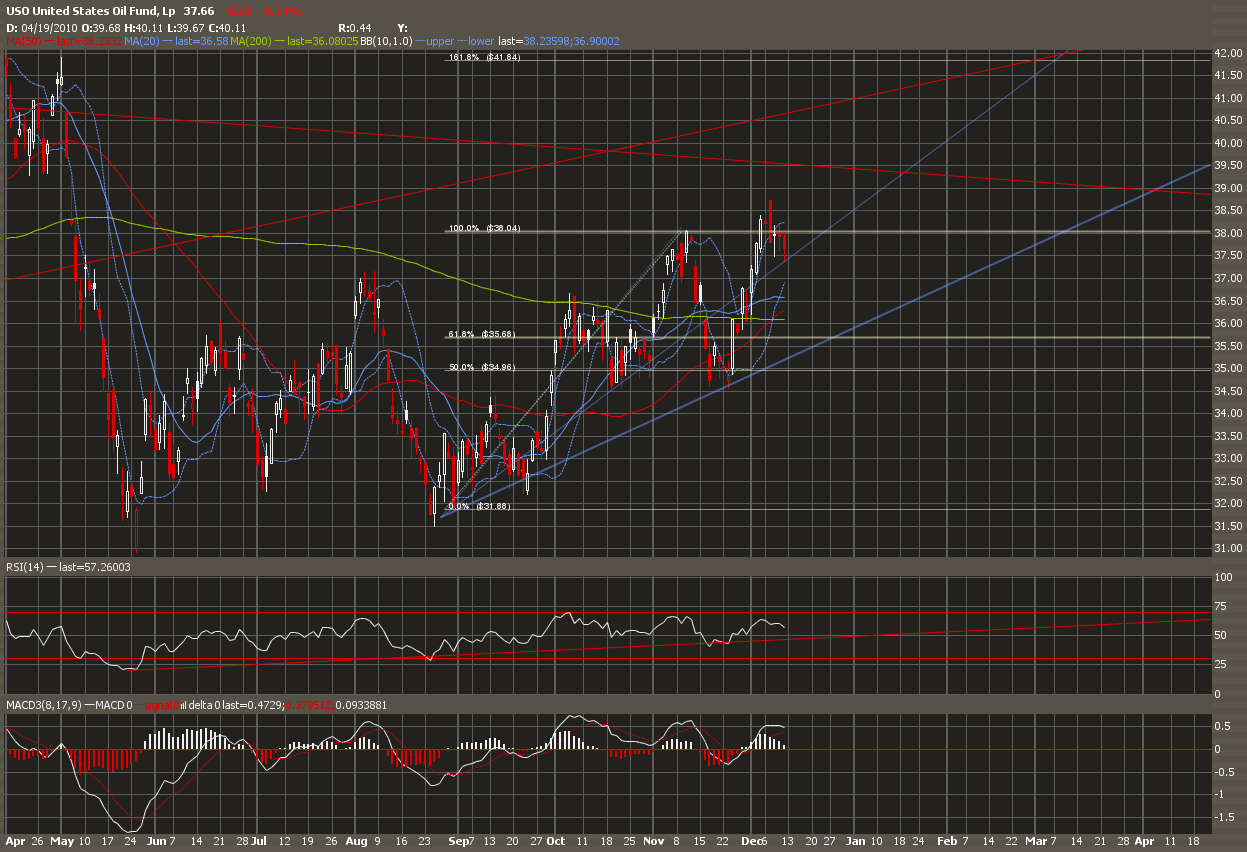
Daily chart for Crude Oil (USO)

Crude is forming a consolidation pattern. Target is still at 41.80.
Daily chart for Natural Gas (UNG)

Natural gas broke below its uptrending channel. This means that it might test support at 5.20 once more. At this point, I do not think it would make a new low. Longer term charts are very bullish with shorter term price weakness.