
Daily chart for S&P

Daily chart for NASDAQ

S&P and NASDAQ had broken to new highs while Dow is still lagging behind. From the looks of RSI and MACD, it seems that the market has some more fuel for a rally. It might dip a bit this coming week but it seems that we might just see a Santa Claus rally at the end of the year. My target would be 1290 on the S&P.
Daily chart for the Dollar (UUP)

The dollar did a bounce off the 20 day moving average. It looks ready to rally up to its first target at 23.80 and the second target at 24.50.
Daily chart for Gold (GLD)

My target for gold is still the same. Final target at 143.
Daily chart for Silver (SLV)

Parabolic silver is getting volatile as it nears the end of its parabolic trend. This is typical of all parabolic trends and this one is no exception. There is a RSI trendline (purple line) and as long as silver keeps above this purple line, this trend will continue.
Daily chart for Crude Oil (USO)
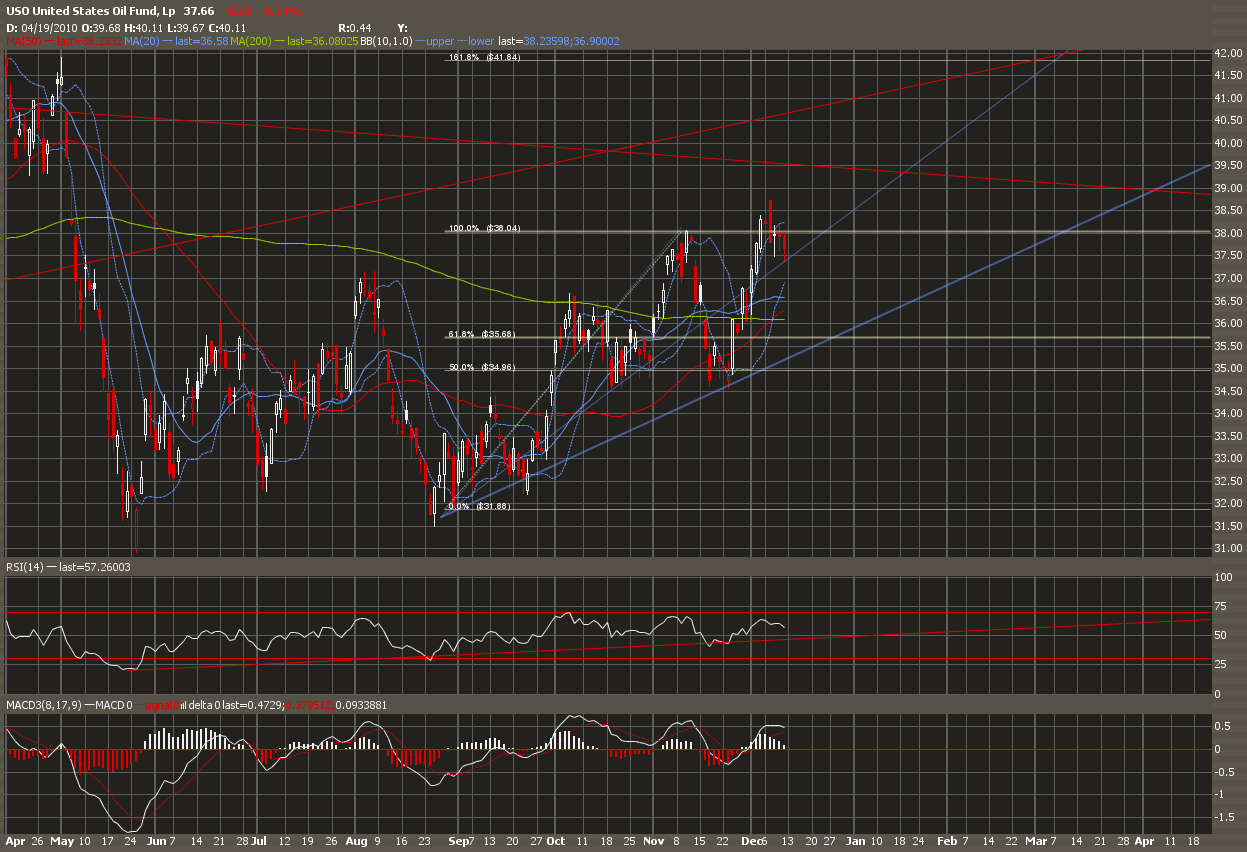
There are no changes for Crude. My target is still at 41.84.
Daily chart for Natural Gas (UNG)

Natural Gas (UNG) had formed a upward channel as it bottoms out of its 2 year downtrend. UNG is at the beginning of a long uptrend that I believe will take 1-2 years to run its course. First target at 7.
No comments:
Post a Comment