I have had friends ask me to tell them when to buy in… and cautious as I am, I have not budged on anything since pulling out profits near the bottom. However, these friends had been overwhelmed by the rallies and some were in for a ride. As of today, the ride possibly ended and I hope that my silence spoke more words than when I a scream about the markets tanking.
Unlike the usual WMA, this one will show some charts, as well as how one can tell that the charts are indicating the future. While it is not at all about predicting nor prophesying, I learnt this skill and belief in the charts from Dave Elliot of WallstreetTeachers.com whom I am very grateful to.
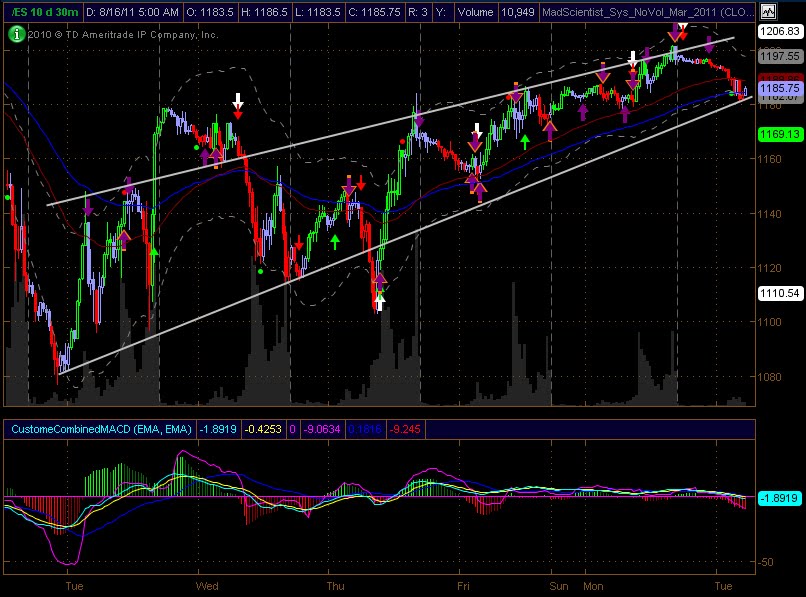
Let us now look at charts...
ES
The 30 min chart shows clearly how a bounce looks like. Using moving averages of the correct period, one can plot failures and breakthroughs. Last Thursday, after a consolidating for two days, the ES broke through the moving averages and tested before the market opened on Friday morning. This test of the moving averages also coincided with a major swing point and the uptrend was established. Similarly, the MACD signaled a bullish rally on Thursday during open market hours and also a confirmation at the point of the moving average test.
The uptrend was lackluster and it appeared to be ready to reverse at some point in the future. While Monday was mildly bullish, at the close, it ended with a swing top and a Sell signal was generated. Coinciding with this point was the rising wedge resistance.
On Tuesday, at the time of writing (6pm SGT/6am ET), Germany had posted unexciting economic results and the major European markets are off 1.5% on average. The ES traded downwards on low volume and is just at the wedge support, having failed one of the moving averages. Breaking the next moving average and the wedge support would see a price breakdown later today.
This price breakdown is highly probable given the obvious technicals such as a price uptrend with flattening MACD and lowering volumes.
The daily chart shows that IF Tuesday closes at the current level or lower, it will form a bearish reversal pattern and the downleg may target as low as 1055. This reversal point comes just at the COP of the Fibonacci retracement and the Fibonacci fan. The target is end August to achieve this 130 point drop in the ES. Sounds unlikely? So did the first two weeks of August to lose 225 points on the ES in two weeks!

Given the current scenario and global outlook, the drop to 1055 at some point in the near future would not be impossible. US Treasuries had possibly just reversed their retracement and the weekly ES chart although in extreme territory signals that there is a good 5 weeks of downtrend to continue. Leading indicators of emerging markets as well as the US indicate a recession as soon as next month and economic data coming out of every country are either short of expectations for growth or just barely making the mark.
The only saving grace is more stimulus money from US, Europe and all other governments particularly China and Japan. However, these countries are at a point where it is beginning to be difficult to splurge without a backlash of inflation and political repercussions.
The flipside is that the ES may just work its way past the immediate resistance of 1200, and test the neckline. In order for that to happen, there needs to be a lot of good news, or at least one big piece of good news to keep the markets propped up for 3-4 days. If the ES does reach the neckline, its technicals as it approaches the neckline would be indicative of what might be probable for the next move.
At this point, while not discounting a huge dead cat bounce, I am inclined to expect that this fat cat can’t bounce, and if it does, it will not take long till we can look for another Sell signal (white/turquoise arrows) near October 2011. A reason for October 2011 is that it is the peak of the 6 year cycle and such peaks bring a heavy selling pressure. Some research has been done and a correlation to natural cycles also coincide with the peaking of 6 year cycles, such as the commodity cycles and also weather patterns such as the flooding of major rivers just before the peaking of the 6 year cycle, ie. Missisippi River in June 2011.
The MadScientist - 16 August 2011
Note: Any material posted here is of my sole opinion, and my opinion may differ from others. It is definitely NOT a solicitation to do anything else as a consequence of reading this material. The material presented here is intended for educational purposes only.
No comments:
Post a Comment