Monday, August 13, 2012

Near the Highs of the Year - Market Analysis for August 13th 2012 by Singaporeseeds


 The past 2 weeks had been really exciting. I traveled to Detroit where I met with my friend and we surveyed Michigan properties together. It was mind-blowing to see properties selling at 30 cents to the dollar and going for yields at around 25%. He had been flipping properties there since 2008 and as of today, he had made 20,000% returns on his money.
Afterwards I drove to Niagara Falls through Ontario, Canada and struck the majestic Falls off my bucket list. Will post a video of it later.
Then it was to Kingston, New York where I met my long-time trading buddy who is working there and then onwards to New York City.
At New York City, I was gazing at the big banks there and fooling around with the ex-Merrill Lynch bull and wondered how it would be like to run a bank. Over the next few days, I just can’t get the thought out of my mind. It will be really fun to make money from nothing but obviously you will need expertise, knowledge and the capital for it. And I’ve not checked but I assume you need a license for it.
Anyway that was exactly a week ago. Over the last 7 days, I thought that if I am to start a bank and also succeed, it cannot start it in a developed country. The established players will destroy me before I can start an office. So it has to be somewhere unsaturated, where people are still foreign to the concept of leverage and then get someone who has experience in bank operations into this with me. And if it is not a developed country, I would definitely need someone with connections to get the license. Lastly would be the capital.
For the capital, I’ve come up with a list of people whom I can call up. So that part’s settled. I’ve also decided on the country and also know a couple of people whom I know have the power and connections to get almost anything they want. So what’s lacking now is someone with expertise but as a person who believes in divine intervention and believes that he’s doing God’s work, I just have a feeling that I will meet this person soon.
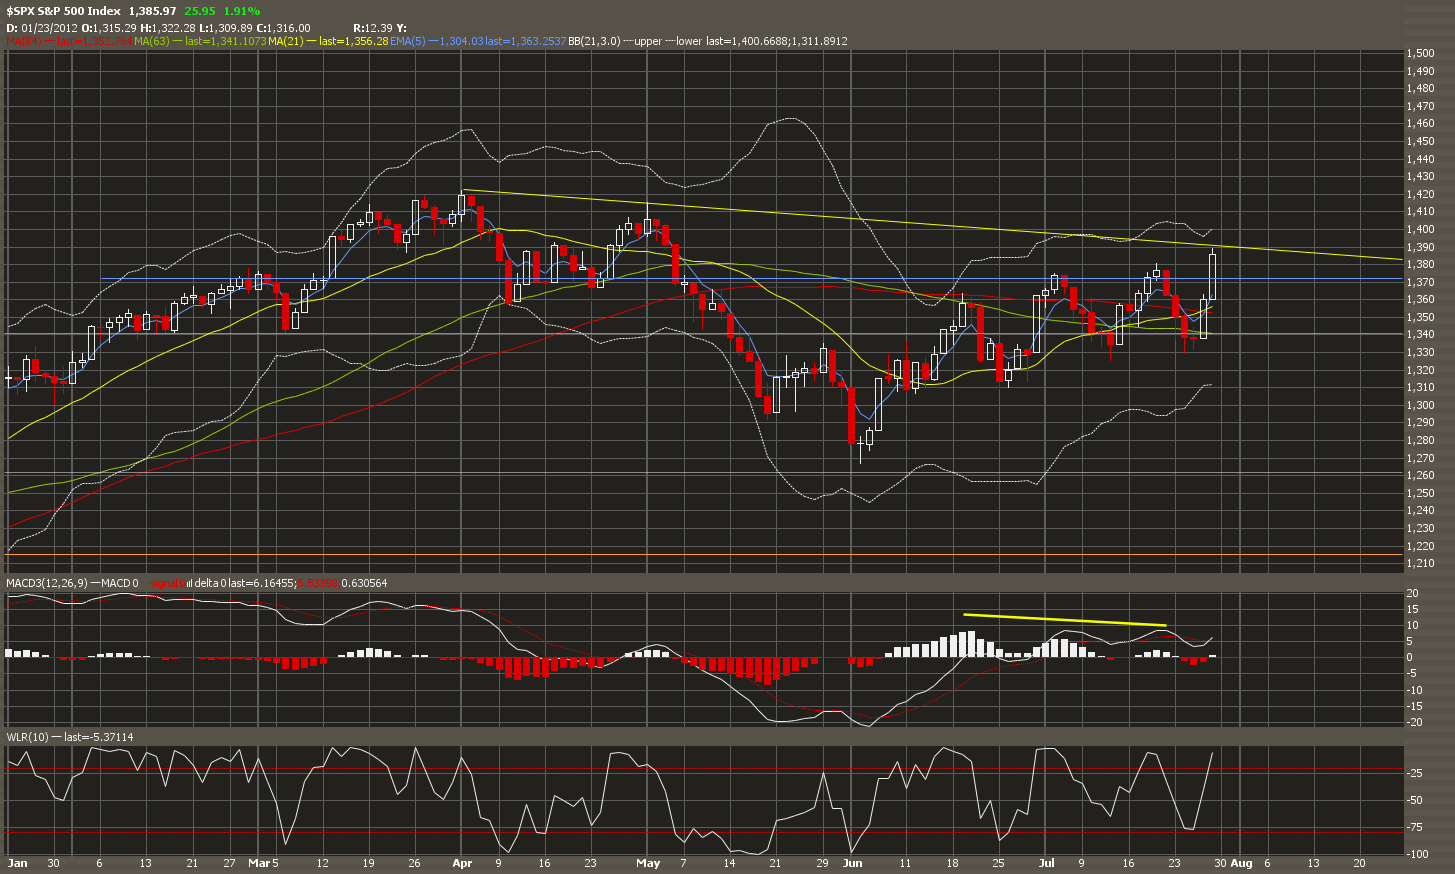
Daily chart for S&P
 

Daily chart for Dow
 

Daily chart for NASDAQ
 

Anyway nothing much has happened over the last 2 weeks. We are still overbought with low volume. Seems like this has been the case over the last 5 weeks and the market is waiting for something to move it in either direction. From my charts, the uptrend has ended last week but I think we should only see movement after this Wednesday.

Daily chart for the Dollar
 

The dollar dropped as expected and is starting to get oversold. There is a strong support around 81.6. We should see it stay above.

Daily chart for Gold
 

Gold is still forming a base with no breakouts either way. However my longer term charts is telling me that the chance of a breakout upwards is more likely. 

Sunday, August 5, 2012

Conrad and the WAT course

Just found out that my blog was selected by Conrad's Appreciation post on Pattern Traders. So just want to reply to his post.

Conrad's WAT course was the defining course in my business & trading career. I started doing business 2005 when I was still in university. Went full scale into it in 2007 when I graduated. Took Conrad's course in early 2008 and it was from Conrad and his WAT course that I found out the scale of the market panic that was going to happen later that year. I dare say that if I had not known about Conrad and the stock market cycle, I would had went bust. Having the ability to make sense of stock charts and market cycles saved me from financial ruin. And I have Conrad to thank for that.

The WAT course is not just for stock traders. It is much much more than that. It is about making sense of the financial world and learning to play the money game. If you are interested in financial success, I would definitely recommend Conrad's WAT course.

Saturday, July 28, 2012

Lonely New High – Market Analysis for July 30th by Singaporeseeds


Daily chart for S&P
 

As I’ve mentioned in my previous post, the start of the downtrend will be when the MACD Histogram turns red. It looked like so until last Thursday when we moved higher on very light volume hence a lonely new high supported only by a few players.  We are 2 days left before the end of the trading month and it is still green so I suppose this is not the time yet. In fact, it looks like we are going to make a new high for the year.

From what I see on my charts, as long as we stay above support at 1366, we will remain bullish. First support at 1366, then 1310.

Daily chart for the Dollar
 

The Dollar (UUP) failed to break resistance at 83.7 and made a failure movement. If it ends down on Monday, it will confirm the downtrend. First support at 81.6, then 79.

Daily chart for Gold
 

Gold broke the wedge that it had been in since December 2011. This is the start of the next leg up for gold. We might dip a bit over the next few days but we should see gold (GLD) rally over the next few weeks. Support at 156.73. Resistance at 164.5 and 174.

Daily chart for Crude Oil
 

Crude Oil (USO) just made a bullish set up. Confirmation will be when it breaks about the 50 day moving average at around 34.6. Before that happens, it is still technically bearish.

Tuesday, July 24, 2012

Just before all hell breaks loose - Market Analysis for July 24th 2012 by Singaporeseeds

It’s been more than a month since I last wrote my market analysis. I went to Myanmar, got to know some really good friends, met up with many old ones and in the process, got to know myself a lot better. I was told this year will be a year of opportunities for me, but I would prefer to say that this is the year I broke my own limitations and realised there were actually nothing stopping me except for those in my own head. From the long cold journey to catch the aurora borealis in March to planning a retail outlet in Myanmar, all these were unimaginable 2 years back when I can barely go out of my house for more than an hour before I started feeling giddy and weak. Just last week, I recovered from gastric flu after a good night’s sleep when usually it would have taken me a week to do so.

As for the one month hiatus, it happened because I had to travel to Myanmar and without the readily available internet connection; I had to exit all my positions. But I was so busy over the next few weeks that I did not have time to look at the market until now. And luckily I did.

Monthly chart for S&P
 

The monthly chart for the market rarely forms bearish divergences but when it does, it goes down in a bad way. As you can see from the yellow trendlines on MACD, it had happened twice since 1996 and both times the market dropped for more than a year. Just based on chart symmetry, I can say that we will be going down to around 600 on the S&P in within a year’s time from now. Right now, the MACD histogram is shortening and when the month ends in a down red histogram, it will be the signal for the start of this year-long downtrend.

I’ve spent the whole of last week arranging to sell off all my stock certificates, unit trusts and accumulating cash on the sidelines. When the drop happens, property will also be hit and I’m waiting to scoop up at least one property in UK when that happens.

Anyway be prepared for another round of global recession. We are now halfway through a major 20 year sideways cycle that will end in 2019. 

Daily chart for S&P


Daily chart for Dow


Daily chart for NASDAQ


On daily charts, all three indexes are showing a bearish divergence. However we are now at a range of support levels and I’m looking for follow through after 2 down days. We should be around 1,286 by end of this week.

Daily chart for the Dollar


There is a bearish divergence for both dollar index futures and UUP. The dollar usually moves in the opposite direction of the market and with the very bearish outlook of the markets, I believe it should rally very soon. So I’ll be looking out for failure signal for this bearish divergence.

Daily chart for Gold


Gold seems to be forming a base around 1550 for a year now. I have a wedge pattern on daily with volatility decreasing. Whichever way it breaks out from, it’s going to be a big movement.   


Thursday, July 12, 2012

Radio check, over... 12 July 20012

It's been a while, and during this time, there has been a nice dead cat bounce.
Today's post is about a possible end to this dead cat bounce rally as we are technically at a decision point turnaround.

/ES
The weekly ES (S&P500 futures) chart show a bounce off the moving averages and a possible failure to make a new high. What is not seen is a reversal of a trend IF the ES closes at its current level or below this Friday. Zooming into the daily ES chart, a uptrending support line is just about to be broken. Having a Sell Signal earlier in the week, with extended indicators as well as a potential bearish crossover of the moving averages, a break of this uptrending support line would see the daily 200 moving average be the next support test, which coincides with the previous low. Price action beyond this low by Friday means a break of the weekly and daily uptrend.
In essence, it technically looks like a turnaround point... however, we are looking for trigger events to bring this successfully into fruition and with much further downside.


/DX

The USD futures weekly and daily charts are showing a renewed interest in a rally. With a new recent high made, it indicates a continuation of the rally un USD. With this, a drop in equities (ES) is correlated. The recent run up in the USD is technically supported by indicator as well as moving averages and the market fueling of the EUR/USD dumping to all time lows


/GC

This is a favourite... cos it is a tad challenging. So many people I know are so bullish on Gold, that it is about time Gold does some distribution. The weekly gold futures chart show the recent Gold double top peaks that had prices test 1550 on many occasions. There seems to be a traiangle formation and indicators are showing a potential divergence. Yet, gold is not breakout and have been ranging over the ast few weeks. The daily charts show that clearly and uite differently show prices below the moving averages with undecided price action and technicals. All said, the range bounadries are closing in and a breakout or breakdown is due... watch for this.


/CL 

Crude futures in recent weeks have had a tough time, and clearly breaking an uptrend. Expect a short term bounce and consolidating range between 80-90.


So there... things are at some decision point. My warnings of a fall in the markets since March 2012 had materialized in May 2012 and since the market has had a bounce... possibly a dead cat bounce. Between now and October, something might happen to pull the markets one way or another... something not seen. IF the markets rally, it is likely to overextend itself and not expecting it to be higher than the high at the beginning of the year. This may be a setup just like it was in July 2008 to September 2008. I am looking for the signs... it might do us all well to keep a look out too.

Fundamentally, everyone is yet again bailing and easing... this time, the markets aren't reacting with that much favour. One might ask oneself why so... and let's keep our eyes out for the answer.

Have a good weekend ahead!

The MadScientist
13 July 2012


Note: ALL material posted here is from my personal opinion, and my opinion may differ or change without notice. These do NOT constitute as solicitation, investment nor financial advice. By reading the materials presented here, Readers acknowledge the awareness that the materials are intended for educational purposes only. For investment(s) advice, related decisions and/or actions pertaining to investments, always consult your own qualified financial advisors, brokers, etc.

Charts are from TD Ameritrade Thinkorswim platform 

Monday, June 4, 2012

Cyprus Next in Line to Seek a Bailout - Market Analysis for week of June 4th 2012 by Singaporeseeds


Daily chart for S&P
 

Daily chart for Dow
 

Daily chart for NASDAQ
 

I wasn’t able to blog about the market last week as my in-laws were visiting. We did a road trip from London to Newtonmore in Scotland. We saw the British Dance Open in Blackpool and visited St Andrew’s Old Golf Course in Scotland. Also went to numerous sightseeing spots along the way. This Thursday, I’ll be going to Rekjavik, the Golden Circle Route and will be feasting on the delicious seafood in Iceland.

Anyway back to the markets….I saw an excellent short entry for the markets on Monday that I took just before I left on the road trip. The markets dropped like a brick over the week and we entered oversold conditions on Friday. We might bounce as far up as 1,345 over the next few days before continuing down to 1,150 for S&P. It is still a downtrend and any rallies will be better entries for shorting.

Recently there’s speculation that Cyprus may be seeking a bailout from the EU. This and a few other really pessimistic news coming from Europe should be enough to keep the market from rallying much.


Daily chart for Gold
 

Quote from my market analysis 2 weeks ago:
“We had gold bounce off support at 1,546 last Thursday. I believe we should see gold test this support again within a week or two before beginning a new rally.“

Gold tested support over the following 2 weeks before making a huge one day rally spike last Friday. This is the beginning of the next rally for gold. I was unable to enter a long position as I was driving somewhere in between the Grampian Mountains gazing at the breathtaking views of the loch and glens of Scotland.

We should see gold rally over the next few days and then come back down to test channel support. That will be a good and safer entry for the next leg up.

Friday, June 1, 2012

What time is it? 1 June 2012

I posted this on my FB Timeline yesterday...

"Ok... Haven't had proper time to blog it... But I am officially worried about the global markets. The price action and overall feel is really uncanny to a couple of years ago. When I get bad vibes, it usually means something.
All the pieces seem to be in place. The time for opportunity is upon us."

And what happened later in the trading session was a (dead cat bounce). Today, about 2 hours ago, the S&P500 started to drop and is currently down 15 points. While I expect a Friday in this climate to be down usually due to not wanting to hold over the weekend, this is more than that. And the usual first day of the month bullish tendency doesn't look anywhere near.

Well, it seems that I am not the only one feeling the bad vibes... Conrad also posted about a feeling of some geographical bad feeling... And only a few minutes into writing this blog post did he post a report on an earthquake in Tokyo.
See: https://www.facebook.com/conradalvinlim

Co-incidence?
I think not...
Some are more attuned to "energy" forces and if we listen hard enough, it's what others call a vibe.

Anyways, this is just one of those things that we independently felt and posted... What it means really will depend on you the reader to decipher. Point being, take heed.

The MadScientist


ShareThis