Daily chart for S&P

Daily chart for NASDAQ

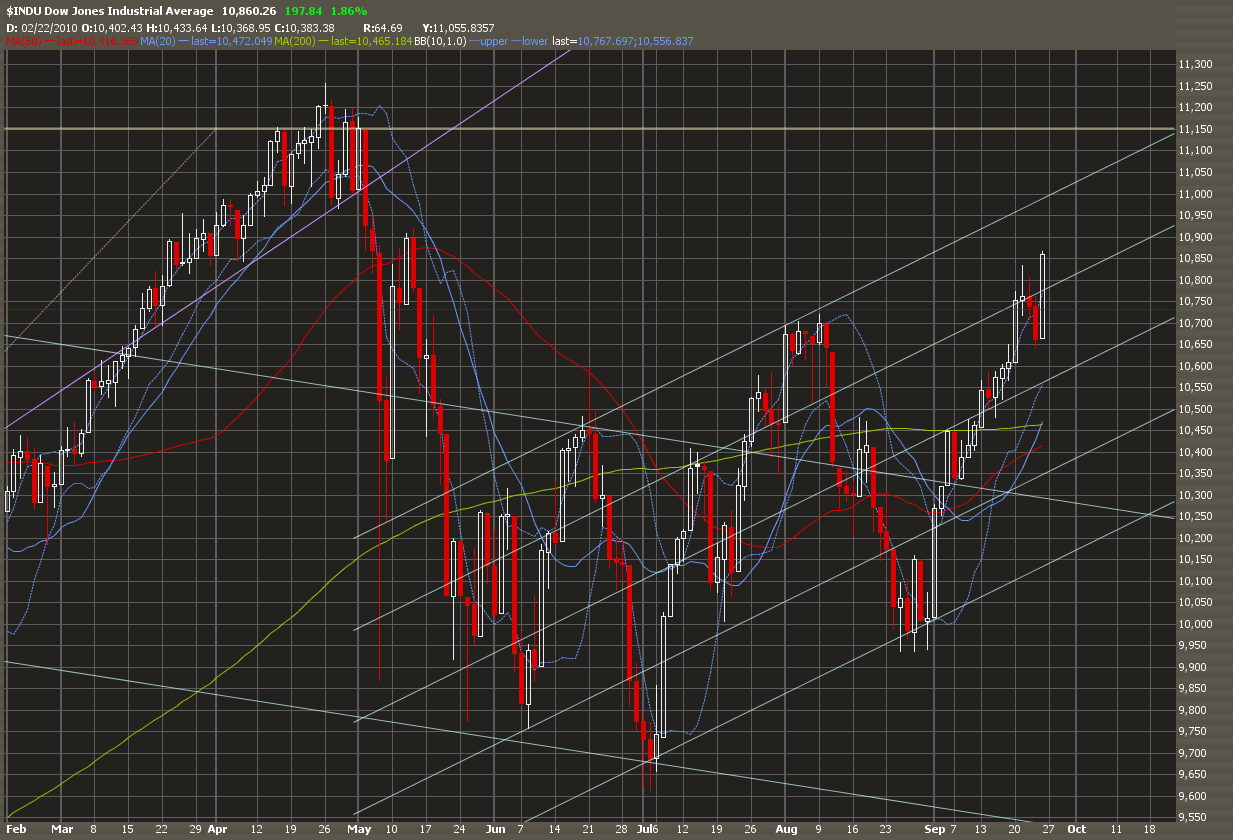
Over the past 2 weeks, all remnants of a bearish trend died. Now the monthly and weekly charts are looking very bullish. As September is supposed to be the one of the most bearish time of the year, we might be at the start of a huge rally that might start on October. However we still have one more week to go and with the huge swings over the past few weeks, we never know what might happen. This might just be a fake out rally which may turn bearish in an instant.
We are currently close to a few major resistance levels so this last week will be a deciding factor. If we are able to keep our gains, then October and the whole of 2011 might be a nice bullish year for us all. Should the market hold its gain this coming week, I’ll be looking at the market hitting 1215 on S&P. This would be 11,200 on Dow.
Daily chart for Gold

I’m looking at gold hitting 1,425 by mid 2011 then dropping back to the red trendline over the next few months after that. I’ve got a feeling that we will not see 3 digit price level gold for many many years to come.
Daily chart for Crude Oil (USO)

Crude Oil (USO) did a fake out of the wedge in April and then proceeded to drop over the next few days to 31. Now it seems ready to drop some more to 28.33 after failing it’s 50 day moving average on the 13th of September. This down movement should be completed by end Oct 2010.
No comments:
Post a Comment