“Now all 3 indexes are sitting right above the monthly pivot support and are all at the all important 50 day moving average. A bounce at this point will mean either the continuation of the huge March 09 rally or a bounce before going to hell or a decisive break below will mean that erm….that its going to hell.”
It went to hell alright. What a ride!
Last night was one of the most exciting nights for a long time and I was actually in a long position on the market around an hour before the market went to hell and back. The market had been tanking the whole night before this and I thought I had got filled at a good price for my long order. The market went sideways after that. Then for some reason that I wasn’t so sure, I decided to take off all my positions at a small loss and went downstairs to watch tv. I came back around 2.30am for the afternoon scalping window and still did not know what had happened. I thought I had zoomed in the charts too much and that’s why the candles appeared so volatile. It was another 10mins later when I realized that the prices at the side of the charts were “wrong”. It was when I switched to daily charts that I saw the extent of the tank. Called everyone that I know to get up and see the action.
I decided to scalp the market but I forgot that my PT and SL were preset at $50. I went in and got closed out at my PT within 3 secs. Then feeling quite pleased with myself, I adjusted my PT and SL to $100. This time it hit my PT in 10 secs. Then after a few more seconds scalp and countless mins messing around with the super lagging platform, I covered all the losses I made earlier in the day and made another 200 bucks. Decided not to continue to scalp because of the frustrating platform and the effect this frustration is having on my mindset. I closed shop and chatted with my wife for a while before going to sleep.
Daily charts for the Dow

Daily charts for S&P 500

Daily charts for NASDAQ

This is what I call irrational behavior. All 3 indexes broke through most of my moving average supports in one night and bounced off the 200 day moving average. I was very tempted to short the market and hold my position over the next few days but I felt that it should bounce back to test the 50 day moving average. Usually in a downtrend, if price does not bounce when it approaches the 50 day moving average and breaks it decisively, it will bounce afterwards and rally to test resistance at the 50 day moving average before continuing its downtrend. So there’s no need to chase the trend.
From the way the market came back after tanking 1000 points on the Dow, any good non-farm payroll number should rally the market back up to the 50 day moving average. Any bad news and the market will be going back to test yesterday’s low.
Crude Oil
Daily charts for Crude Oil

Crude tanked together with the markets and is at support. It seems that crude oil is moving together with the markets now and it should be bouncing with the markets too. My target for crude is at 70.
Gold
Daily charts for Gold
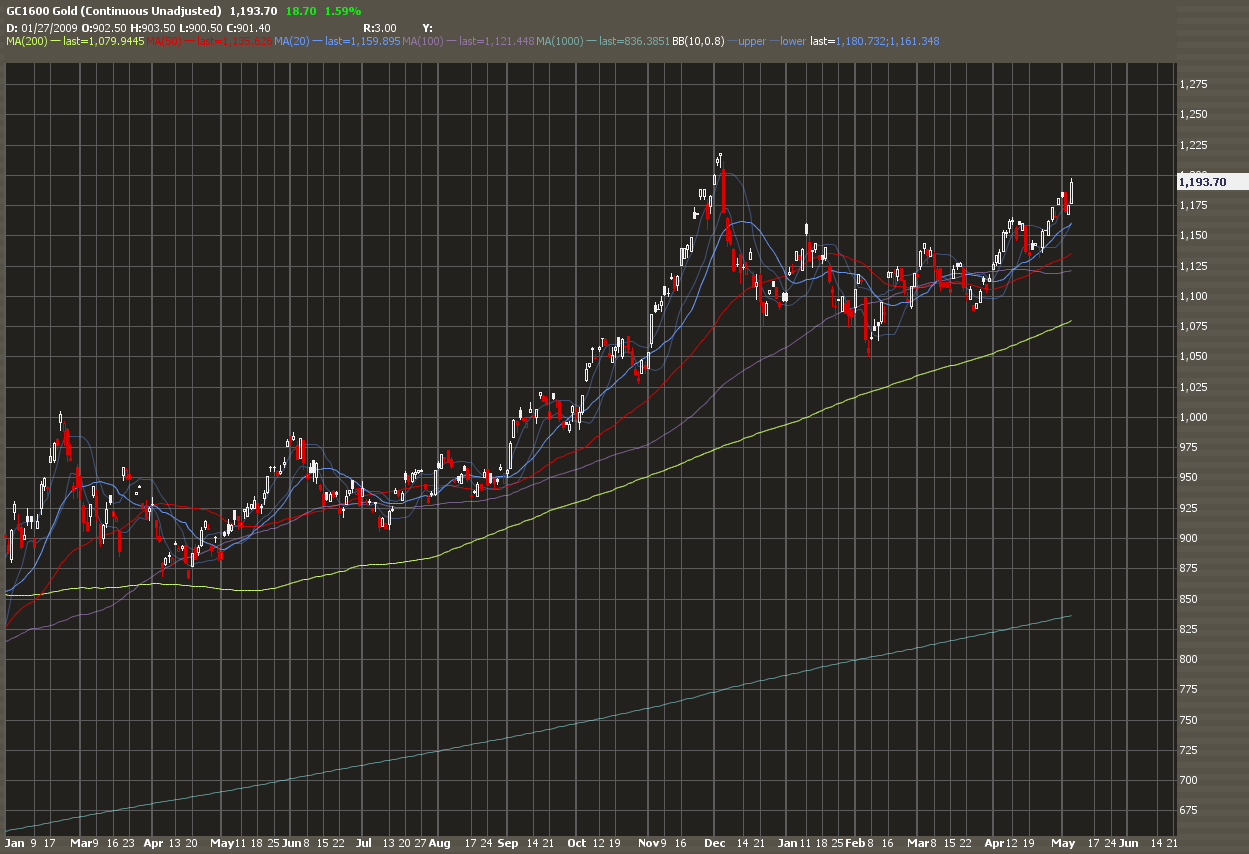
Gold looks like the only thing that rallied last night. Gold should be rallying over the next few days to 1215. Whether it will break this previous high will depend on its movement over the next few days.
No comments:
Post a Comment